The solar flames up close: Recently examined data provides the initial high-resolution perspective of the complete solar disk.
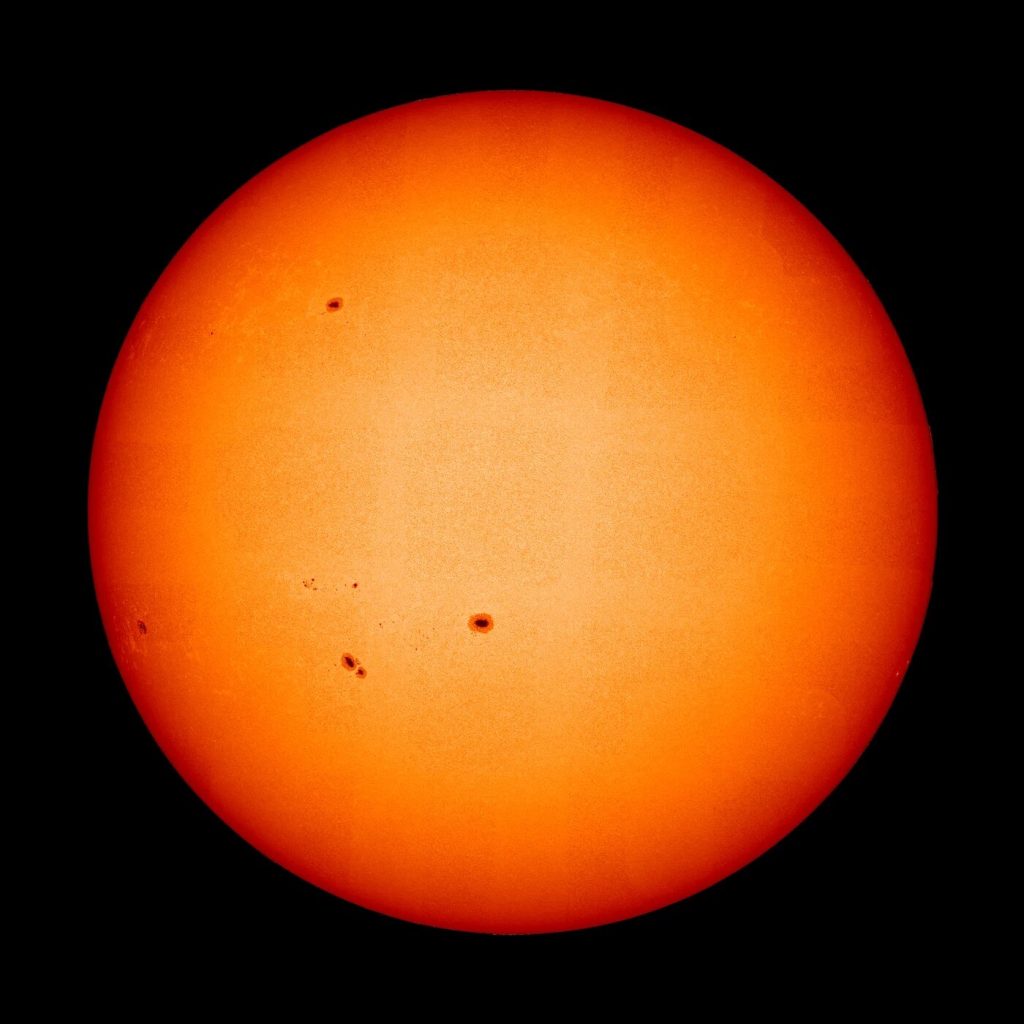
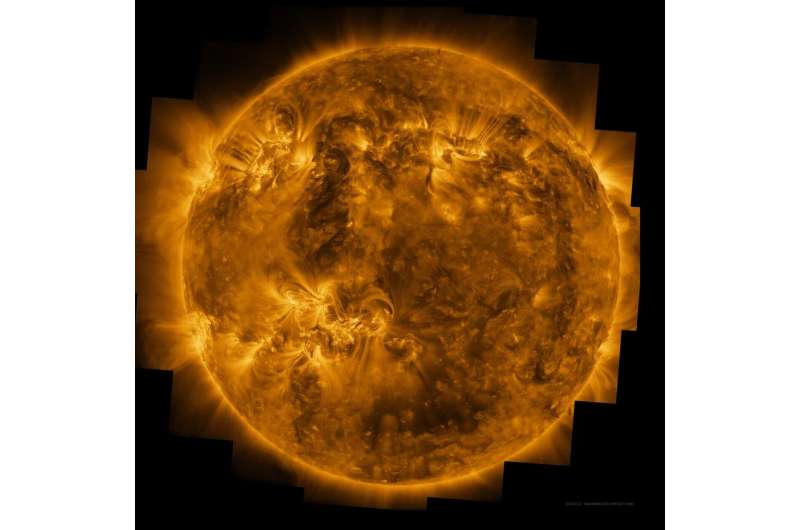
The solar fire up close: Newly analyzed data offers first high-resolution view of the entire solar disk (Image Credit: Phys.org)
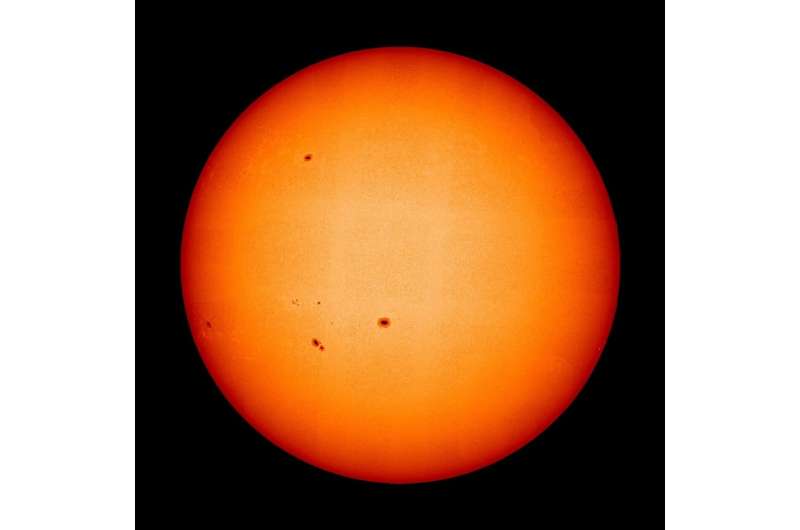
The entire solar disk in unprecedented detail—this is shown by images of the visible surface of the sun, which researchers at the Max Planck Institute for Solar System Research have now created from 25 individual images taken by the ESA space probe Solar Orbiter.
During the observations in March 2023, the satellite was only half as far away from the sun as Earth. Here, the solar disk was already too large to fit into a single photo. If you zoom in on the images from the various instruments that have now been published, you can see where the sun is displaying its temper. The surface resembles a boiling water surface.
Here, plasma is rising from the sun’s interior. Dark sunspots are also spots of particularly strong magnetic fields. And wide magnetic field loops, larger than the Earth, form a racetrack for solar plasma, which whizzes along there at over 100,000 kilometers per hour.
No body in our solar system is as dynamic and complex as the sun. In order to understand as many of its caprices as possible, the ESA’s Solar Orbiter spacecraft set off in February 2020 with a total of six measuring instruments in the direction of our home star, in order to look under and into the various layers of our star.
The Max Planck Institute for Solar System Research sent hardware for four of the instruments on the journey to the fireball. For example, EUI captures the sun’s particularly short-wave ultraviolet radiation which originates primarily in its hot outer atmosphere, the solar corona.
The double telescope PHI focuses on the visible surface below, the photosphere. The light emitted from there also contains information about the strength of the sun’s magnetic field and the velocity of the solar plasma. The images published today are derived from EUI and PHI data from March 22, 2023.
As close as possible
“If you want to understand the sun in its entirety, it is essential to look into all its layers simultaneously and with high resolution,” said Prof. Dr. Sami K. Solanki, MPS Director and PHI Principal Investigator. “Solar Orbiter is capable of this like no space probe before.”
In addition to its extensive instrumentation, another of Solar Orbiter’s advantages is its unusual trajectory. It takes the spacecraft on long ellipses around the sun—and thus repeatedly allows it to approach our star to less than a third of the distance between the Earth and the sun. This corresponds to around 42 million kilometers.
A mosaic of 25 individual images
On 22 March of last year, approximately 74 million kilometers separated Solar Orbiter and the sun. At this “proximity,” the sun is too large to fit completely into the field of view of PHI’s high-resolution telescope. Instead, a total of 25 images of parts of the sun were taken over a period of several hours, which researchers from the PHI team have now combined in a mosaic to create full-disk views.
“The information we need for our magnetic maps of the sun, for example, is hidden in only a tiny part of the captured light,” explained MPS scientist Dr. Johann Hirzberger from the PHI team, who created the mosaics.
“The data can therefore only barely be compressed on board the probe. Due to the large distance to Earth and the comparatively low data transfer rate, the huge amounts of data that are generated in this way sometimes reach us only months after the actual observations.”
Discover the latest in science, tech, and space with over 100,000 subscribers who rely on Phys.org for daily insights.
Sign up for our free newsletter and get updates on breakthroughs,
innovations, and research that matter—daily or weekly.
Since Solar Orbiter continues its journey around the sun even during the measurements, the individual images are all taken from slightly different perspectives. These effects must be carefully taken into account when piecing together the mosaics.
Nevertheless, the PHI team expects to be able to provide similar high-resolution views of the entire solar disk more quickly and regularly in the future, approximately twice a year. They will help to understand how our grasp of the sun as a whole is governed by its smallest structures and processes.
The full-disk images of the photosphere published today have a resolution of around 175 kilometers per pixel. In terms of detail, they fall short of those obtained by the most powerful solar telescopes on Earth. The Gregor solar telescope on Tenerife, for example, in which the Max Planck Institute for Solar System Research is also involved, is able to depict structures of just 50 kilometers in a pixel using its 1.5-meter mirror.
However, the ground-based telescopes can only image a very small section of the solar surface in high resolution. And due to the difficult observation conditions on Earth, where constant air turbulence disturbs the view, it is hardly possible to ever put these “snippets of the sun” together to form a whole. As the Earth’s atmosphere also absorbs most of the sun’s ultraviolet radiation, simultaneous images of the corona from Earth are also not possible.
Sunspots and complex magnetic field
Zooming in on the new images of the sun reveals the full complexity and beauty of our star. In visible light, a granular pattern covers the photosphere. It is an expression of the hot plasma that rises inside the sun, cools and sinks down again—very similar to boiling water on a stove top. Sunspots, dark areas on the solar surface, can also be seen.
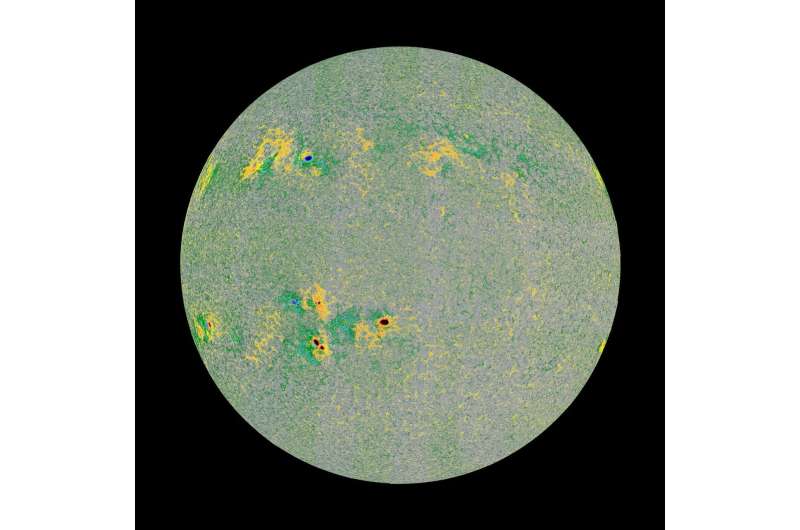
As PHI’s magnetic map, the magnetogram, shows, the sun’s magnetic field is particularly strong in these areas. It prevents hot plasma from rising from the depths. In the area of the sunspots, the solar surface is therefore cooler and appears darker. The different colors in the magnetogram represent the strength and direction of the magnetic field. The strongest fields are shown in red (pointing outwards) and blue (pointing inwards).
Every eleven years, the sun’s surface is in chaos
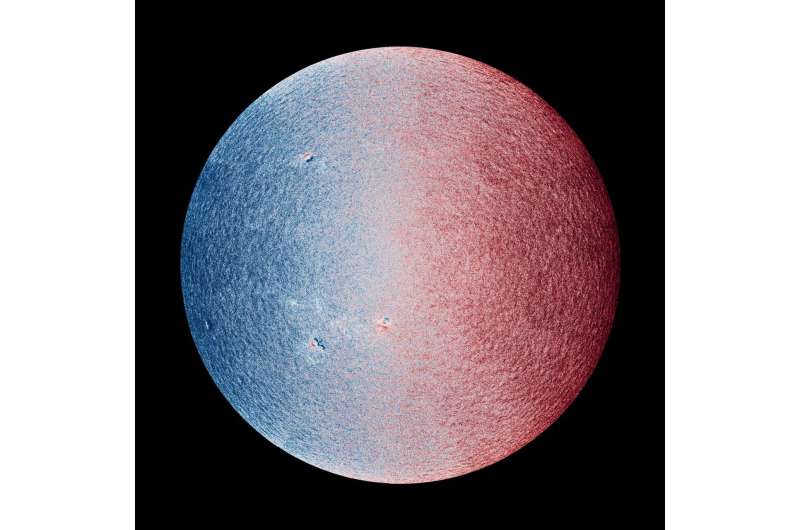
These data provide a detailed overview of the extreme processes inside and outside the sun. They should reveal, for example, exactly how the magnetic field is created and why the sun is particularly active every eleven years. It is known that the sun rotates, as shown by the red-and-blue colored tachogram in the adjacent figure, and with it the plasma in its interior, as if a goldfish bowl had been stirred vigorously.
The magnetic fields that arise in this way wind up as a result of the rotation of the plasma ball—a jumble of field lines that also forms loops, especially above sunspots. Along these loops, solar plasma rises and sinks again towards the surface. This movement can also be seen in the tachogram.
In the event of a magnetic short circuit, the sun hurls charged plasma particles into space. When these particles hit the Earth’s magnetic field, auroras light up, especially at the poles, due to the fluorescence effects of the solar particles in the Earth’s atmosphere. The image shown here shows the sun in such a chaotic and thus active phase, in which more sunspots appear than usual.
However, the sun is only in this state every eleven years and is otherwise less active. The sun’s magnetic field is actually more orderly and dipole-shaped, like the Earth’s. Here, too, rotation plays a role, because, according to the theory, hot plasma currents that rise and fall inside the sun and turn in circles like a dynamo with the rotation of the sun arise from this. Every 9 to 13 years, this field completely inverts and also goes through the chaotic state described.
Provided byMax Planck Society
The solar fire up close: Newly analyzed data offers first high-resolution view of the entire solar disk (2024, November 22)
retrieved 23 November 2024
from https://phys.org/news/2024-11-solar-newly-high-resolution-view.html
part may be reproduced without the written permission. The content is provided for information purposes only.


