A 3D map shows that our solar system’s local bubble contains an ‘escape tunnel.’
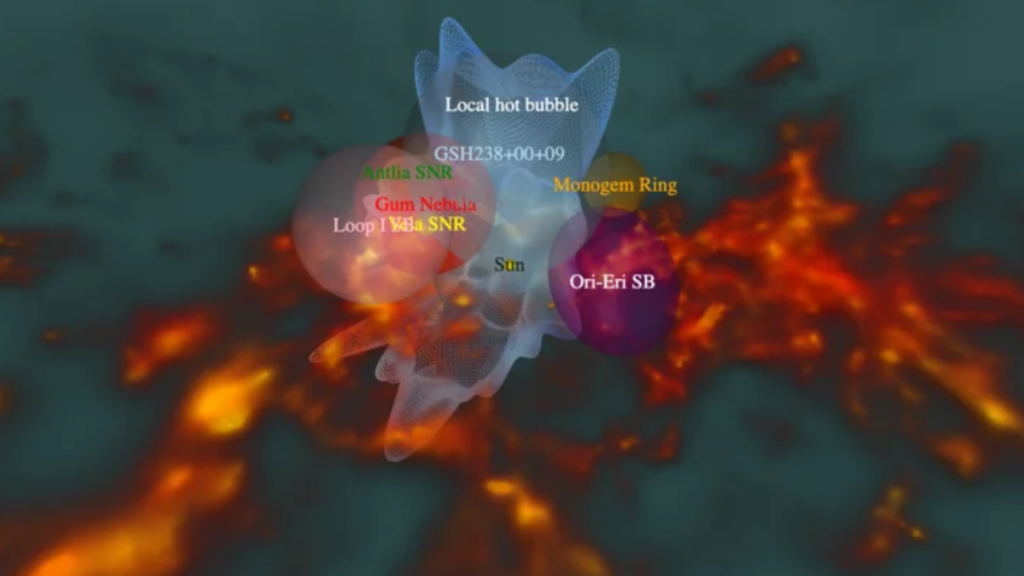
3D map reveals our solar system’s local bubble has an ‘escape tunnel’ (Image Credit: Space.com)
Using data from the eROSITA All-Sky Survey, astronomers have created a 3D map of the low-density bubble of X-ray-emitting, million-degree hot gas that surrounds the solar system.
The investigation has revealed a large-scale temperature gradient within this bubble, called the Local Hot Bubble (LHB), meaning it contains both hot and cold spots. The team suspects that this temperature gradient may have been caused by exploding massive stars detonating in supernovas, causing the bubble to be reheated. This reheating would cause the pocket of low-density gas to expand.
The researchers also found what seems to be an “interstellar tunnel,” a channel between stars directed towards the constellation Centaurus. This tunnel may link the solar system’s home bubble with a neighboring superbubble and could have been carved out by erupting young stars and powerful and high-speed stellar winds.
Scientists have been aware of the LHB concept for at least five decades. This cavity of low-density gas was first suggested to explain background measurements of relatively low-energy, or “soft,” X-rays. These photons, with an energy of around 0.2 electronvolts (eV), can’t travel very far through interstellar space before being absorbed.
The fact that our immediate solar neighborhood is devoid of large quantities of interstellar dust that could emit these photons suggested the existence of soft X-ray emitting plasma that displaces neutral materials around the solar system in a “Local Hot Bubble.” Thus, theories of the LHB were born.
One of the major problems with this theory emerged in 1996, when scientists found that exchanges between the solar wind, a stream of charged particles blown out by the sun, and particles in Earth’s “geocorona,” the outermost layer of our planet’s atmosphere, emit X-ray photons with energies similar to those proposed to originate from the LHB.
Understanding the solar system’s local bubble
The eROSITA telescope, the primary instrument of the Spectrum-Roentgen-Gamma (SRG) mission launched in 2019, is the ideal instrument to tackle this conundrum. At 1 million miles (1.5 million kilometers) from Earth, eROSITA is the first X-ray telescope to observe the universe from outside Earth’s geocorona, meaning potential X-ray “noise” can be ruled out of observations of photons from the LHB.
Additionally, eROSITA’s All-Sky Survey (eRASS1) collected data during a lull in the sun’s 11-year solar cycle when solar winds are weak, called the “solar minimum.” This reduced the amount of contamination coming from solar wind exchange.
“In other words, the eRASS1 data released to the public this year provides the cleanest view of the X-ray sky to date, making it the perfect instrument for studying the LHB,” team leader Michael Yeung, a researcher at Max Planck Institute of Physics (MPE), said in a statement.
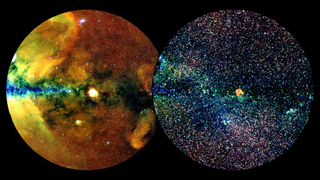
After dividing the hemisphere of the Milky Way into 2,000 distinct regions, Yeung and colleagues analyzed the light from all these regions. What they discovered was a clear disparity in temperatures in the LHB, with the Galactic North cooler than the Galactic South.
The same team had already established that the hot gas of the LHB is relatively uniform in terms of its density. Comparing this to the gas in cool and dense molecular clouds at the edge of the LHB, the team was able to create a detailed 3D map of the LHB.
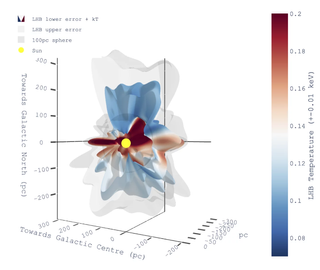
This revealed that the LHB is stretched toward the poles of the galactic hemisphere. Hot gas expands in the direction that offers the least resistance, which, in this case, is away from the galactic disk. Thus, this wasn’t a huge surprise to the researchers as it is also finding that had been revealed by eROSITA’s predecessor, ROSAT, around 3 decades ago.
But, the new 3D map did reveal something hitherto unknown.
“What we didn’t know was the existence of an interstellar tunnel towards Centaurus, which carves a gap in the cooler interstellar medium,” team member and MPE physicist Michael Freyberg said in the statement. “This region stands out in stark relief thanks to the much-improved sensitivity of eROSITA and a vastly different surveying strategy compared to ROSAT.”
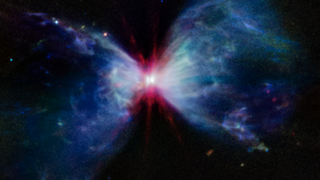
Excitingly, the team suspects that the Centaurus tunnel in the LHB may just be a part of a network of hot gas tunnels that bore their way between the cool gas of the interstellar medium between stars.
This interstellar medium network would be maintained and sustained by the influence of stars in the form of stellar winds, the supernovas that mark the death of massive stars, and jets blasting out from newly formed stars or “protostars.”
These phenomena are collectively referred to as “stellar feedback,” and they are believed to sweep across the Milky Way, thereby shaping it.
In addition to the 3D map of the LHB, the team also created a census of supernova wreckage, superbubbles, and dust, which they incorporated into the map to build a 3D interactive model of the solar system’s cosmic neighborhood.
This included another previously known interstellar medium tunnel called the Canis Majoris tunnel. This is thought to stretch between the LHB and the Gum nebula or between the LHB and GSH238+00+09, a more distant superbubble.
They also mapped dense molecular clouds at the edge of the LHB that are racing away from us. These clouds could have been built when the LHB was “cleared” and denser material was swept to its extremities. This could also give a hint as to when the sun entered this local low-density bubble.
“Another interesting fact is that the sun must have entered the LHB a few million years ago, a short time compared to the age of the sun [4.6 billion years],” team member and MPE scientist Gabriele Ponti said. “It is purely coincidental that the sun seems to occupy a relatively central position in the LHB as we continuously move through the Milky Way.”
You can explore the team’s 3D model of our solar neighborhood here.


